RFM and Cohort Analysis
Customer RFM Analysis (based on Walmart Dataset)
Select Customer to find their RFM Segment
Select a Segment to see grouping per that segment
Segment Statistics
| Customer ID | Recency (days) | Frequency | Monetary | RFM Score |
|---|
Segment Analysis Result in Single Table
The following table displays customer segmentation based on RFM analysis of the Walmart marketplace dataset.
Loading results...
| Customer ID | Recency (days) | Frequency | Monetary | RFM Score | Segment |
|---|
Customer Cohort Analysis (based on Walmart Dataset)
Understanding Cohort Analysis
Cohort analysis is a powerful analytical tool that groups customers based on shared characteristics or experiences within specific time periods. In this analysis, we track customer behavior across different cohorts to understand:
- Customer retention patterns over time
- Revenue generation trends for each cohort
- Conversion rates and customer loyalty
- Seasonal impacts on customer behavior
The following visualizations provide insights into customer behavior from October 2023 to February 2024.
Customer Cohort Size Analysis
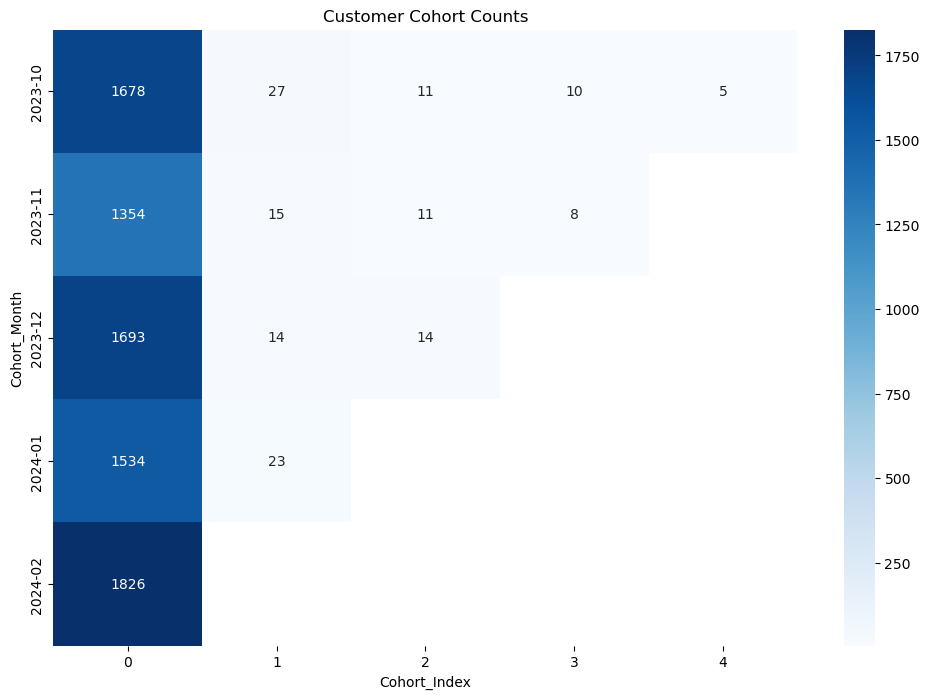
Interpretation
- • Initial Cohort Sizes: Each month shows strong initial customer acquisition, ranging from 1,354 to 1,826 customers.
- • Retention Pattern: Sharp decline after the first month, with only 14-27 customers returning in month 1.
- • Long-term Retention: October 2023 cohort shows the most stable long-term retention, maintaining 5 customers by month 4.
- • Recent Growth: February 2024 shows the largest initial cohort (1,826 customers), indicating successful customer acquisition.
- • Seasonal Trends: December 2023 shows strong initial numbers (1,693), possibly due to holiday season shopping.
Customer Retention Patterns
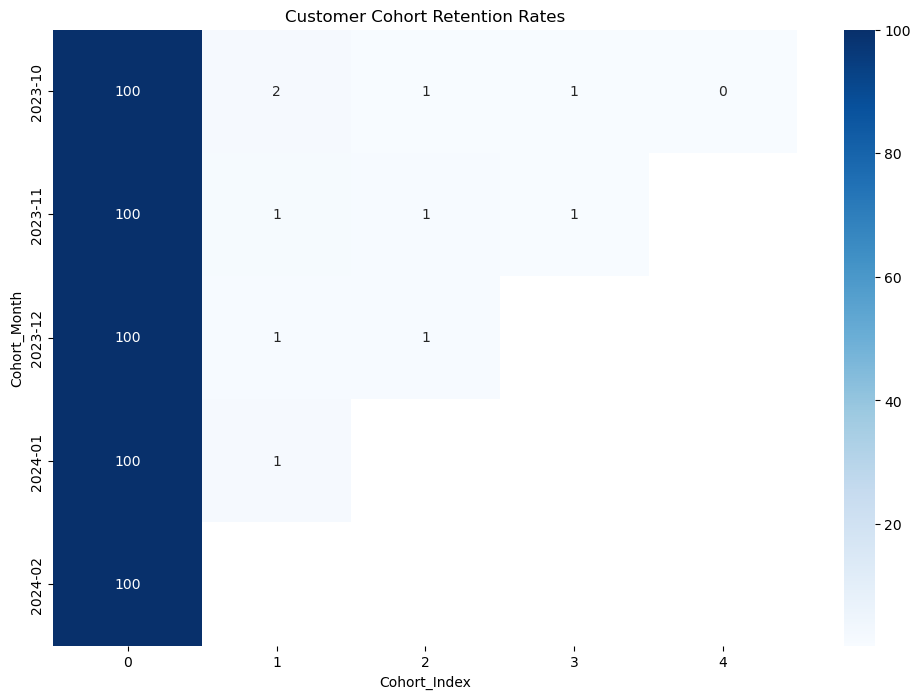
Interpretation
- • Initial Drop: All cohorts show significant drop in retention after the first month, retaining only 0.8-1.6% of customers.
- • Best Retention: October 2023 cohort shows the highest initial retention (1.61%) and maintains the longest retention span.
- • Improving Trend: January 2024 shows improved month 1 retention (1.50%) compared to December (0.83%).
- • Consistent Pattern: Most cohorts stabilize around 0.6% retention by month 3.
- • December Impact: Holiday season cohort (December 2023) shows lower initial retention but more stable subsequent months.
Cohort Revenue Analysis
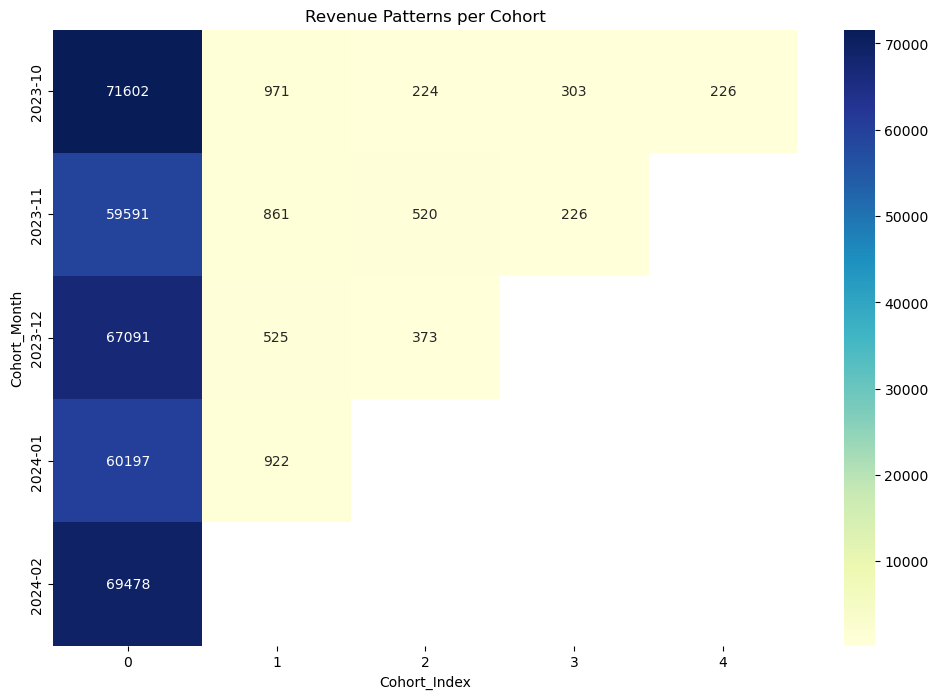
Interpretation
- • Initial Revenue: Strong first-month revenue across all cohorts ($59K-$71K).
- • Revenue Decay: Sharp decline in subsequent months, dropping to $500-$970 in month 1.
- • October Resilience: October 2023 cohort shows most consistent revenue generation, maintaining $226 by month 4.
- • Recent Performance: January 2024 shows strong month 1 revenue ($922) despite fewer returning customers.
- • Seasonal Impact: December 2023 shows high initial revenue ($67K) but lower subsequent months.
RFM-based Customer Segmentation Analysis
RFM stands for Recency, Frequency, and Monetary. It's a customer segmentation technique used to analyze and understand customer behavior.
These three factors help businesses understand how engaged and valuable their customers are and help create targeted marketing strategies to retain and engage them better.
RFM Analysis
- Recency: How recently a customer made a purchase.
- Frequency: How often a customer makes a purchase.
- Monetary: How much money a customer spends.
Customer Segments
Cohort Analysis
Time-based Cohorts
- Customer acquisition date
- First purchase month
- Seasonal patterns
Behavior Metrics
- Retention rates
- Purchase frequency
- Average order value
Analysis Metrics
Customer Lifetime Value
- Average purchase value
- Purchase frequency
- Customer lifespan
Retention Metrics
- Churn rate
- Repeat purchase rate
- Time between purchases
Model Performance Analysis
Our Random Forest Classifier demonstrates exceptional performance in customer segmentation, with near-perfect accuracy across both training and test sets.
Test Set Performance
Confusion Matrix
[[376   0   1]
 [  0 579   2]
 [  2   6 569]]
Classification Metrics
| Segment | Precision | Recall | F1-score |
|---|---|---|---|
| New Customers | 0.99 | 1.00 | 1.00 |
| At-Risk Customers | 0.99 | 1.00 | 0.99 |
| Lost Customers | 0.99 | 0.99 | 0.99 |
Train Set Performance
Confusion Matrix
[[1506    0    0]
 [   0 2326    0]
 [    8   12 2288]]
Classification Metrics
| Segment | Precision | Recall | F1-score |
|---|---|---|---|
| New Customers | 0.99 | 1.00 | 1.00 |
| At-Risk Customers | 0.99 | 1.00 | 1.00 |
| Lost Customers | 1.00 | 0.99 | 1.00 |
Model Interpretation
Overall Performance: The model achieves exceptional accuracy of 99% on both test and training sets, indicating robust and reliable customer segmentation.
Segment-wise Analysis:
- New Customers: Perfect precision and recall (1.00), indicating highly accurate identification of new customers.
- At-Risk Customers: Excellent performance with 0.99 F1-score, showing reliable detection of customers at risk.
- Lost Customers: Strong performance (0.99 F1-score) with minimal misclassification.
Model Stability: Similar performance metrics between training and test sets suggest good generalization without overfitting.